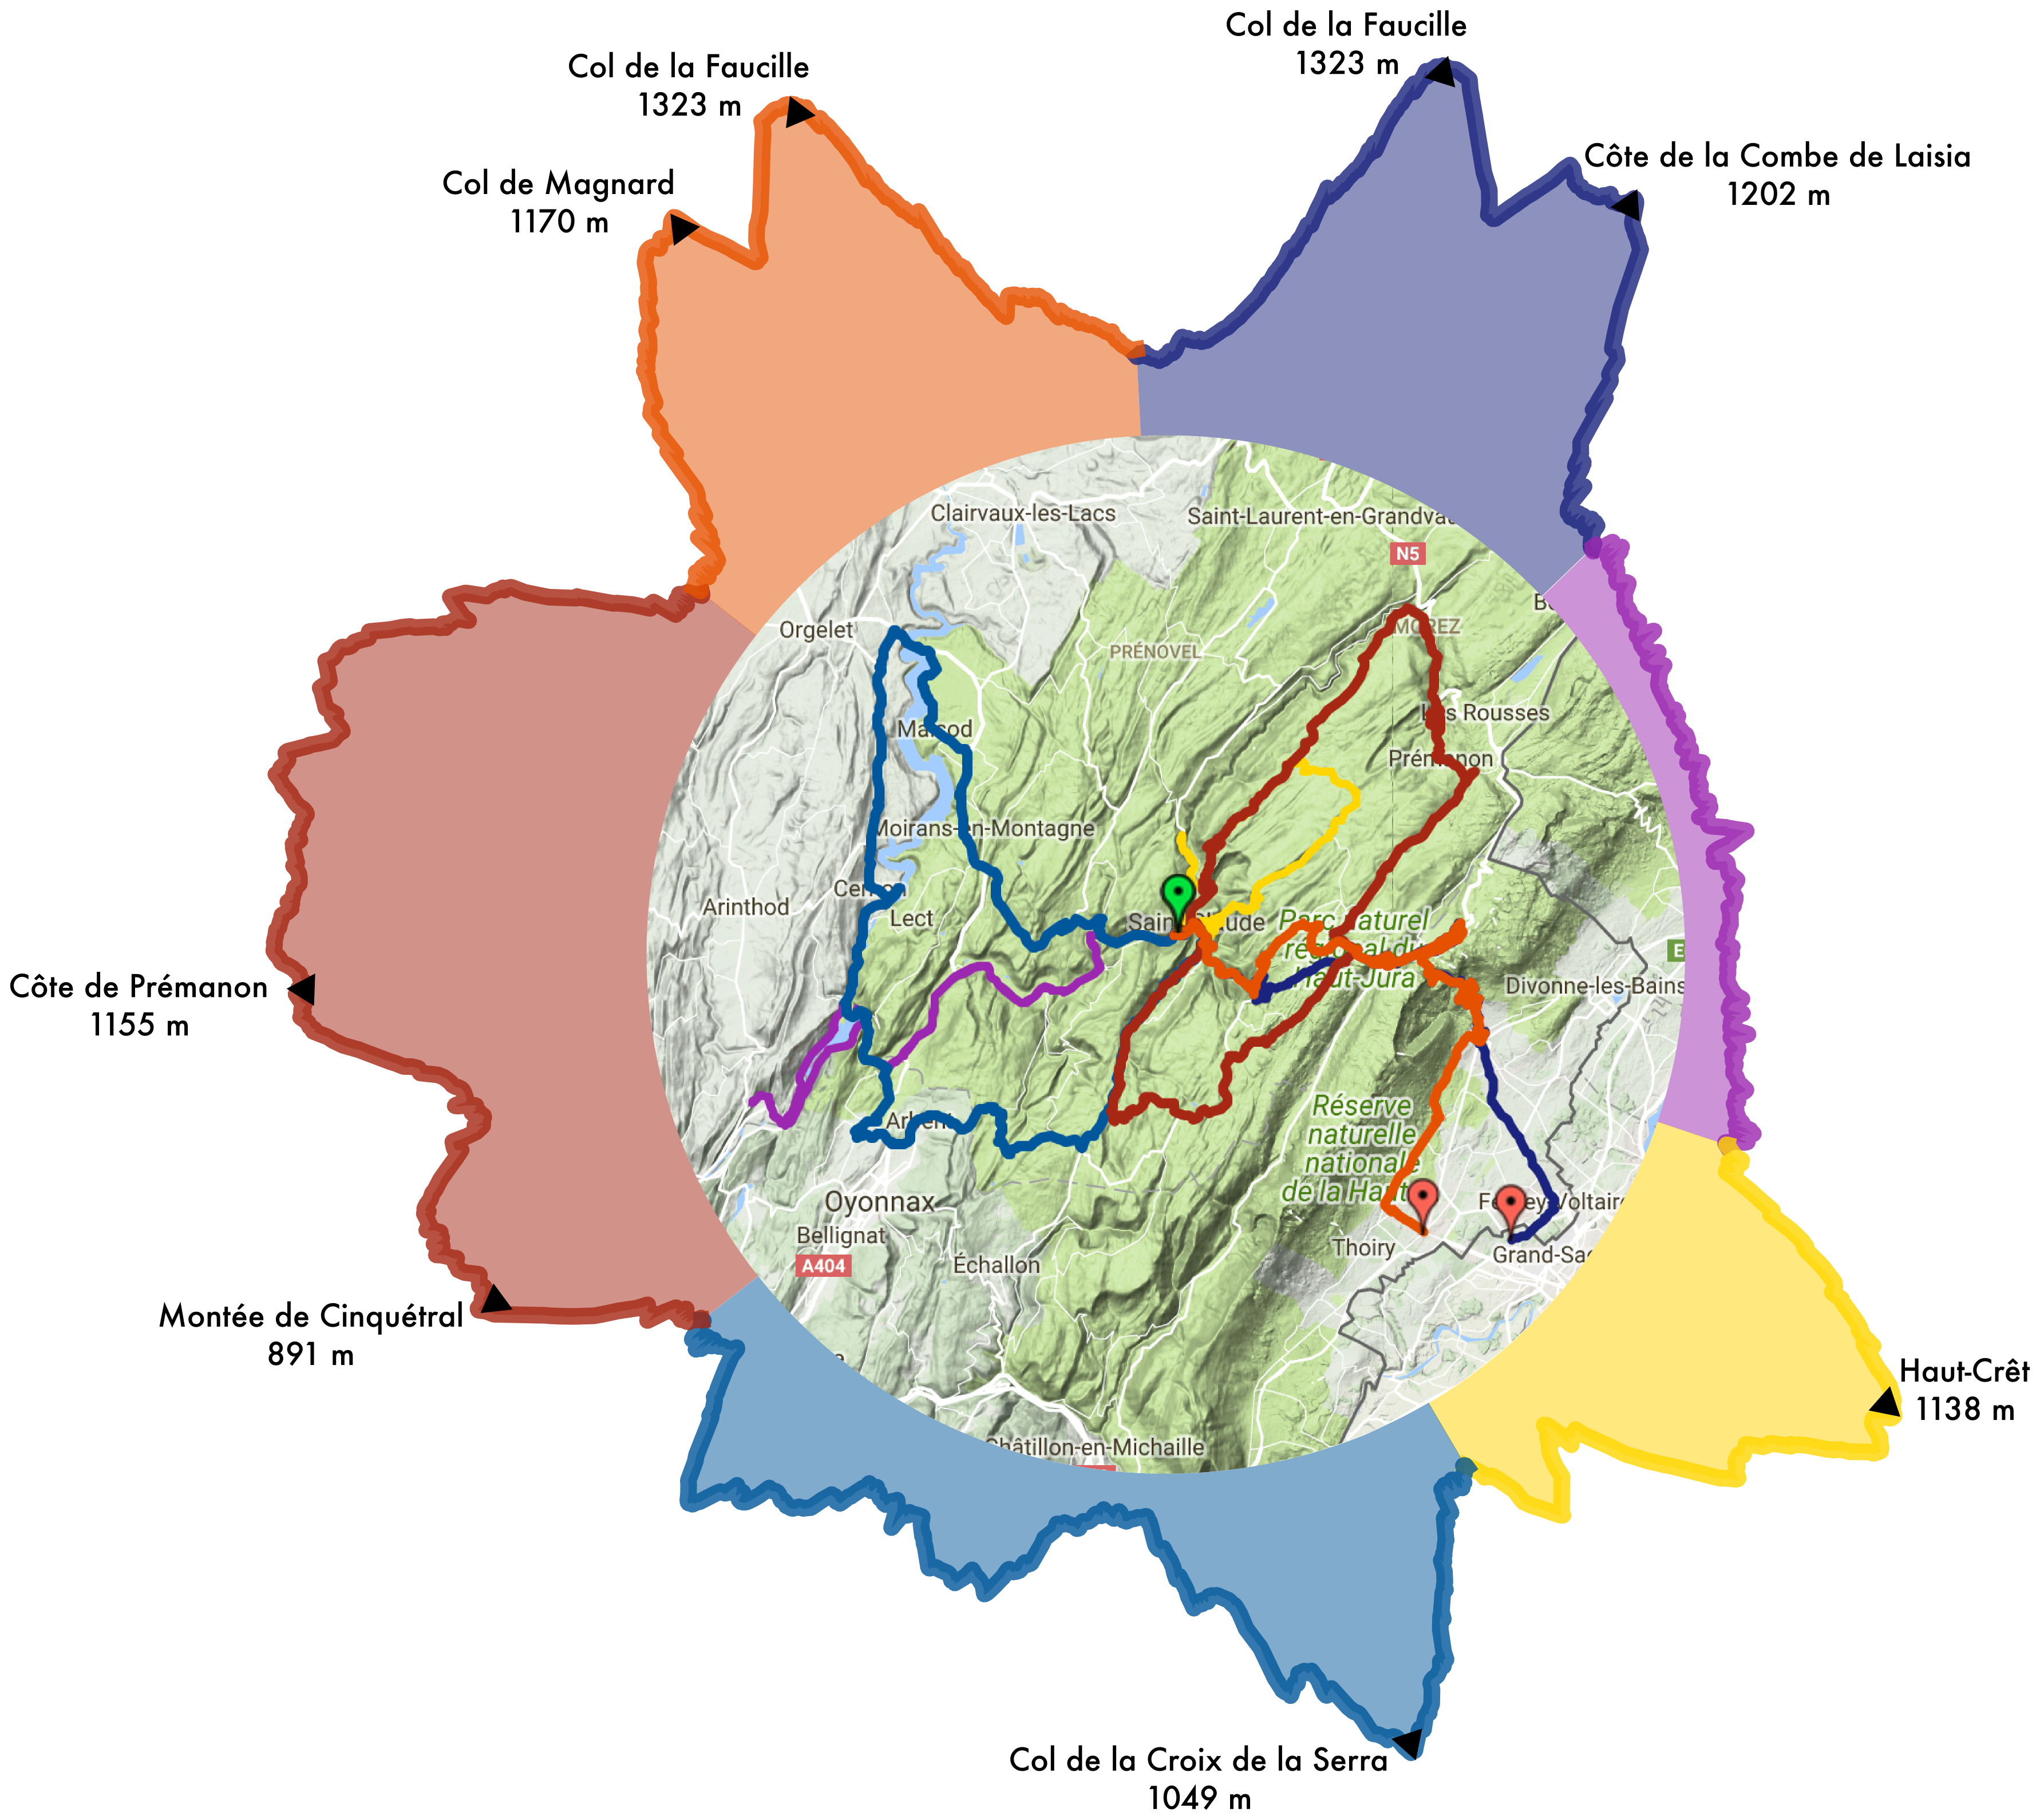
a week cycling in Saint-Claude
Combines a circular elevation plot made using gpxpy and gpx files, google maps for the routes, and a bit of post-editing by hand to accurate add the col markers.
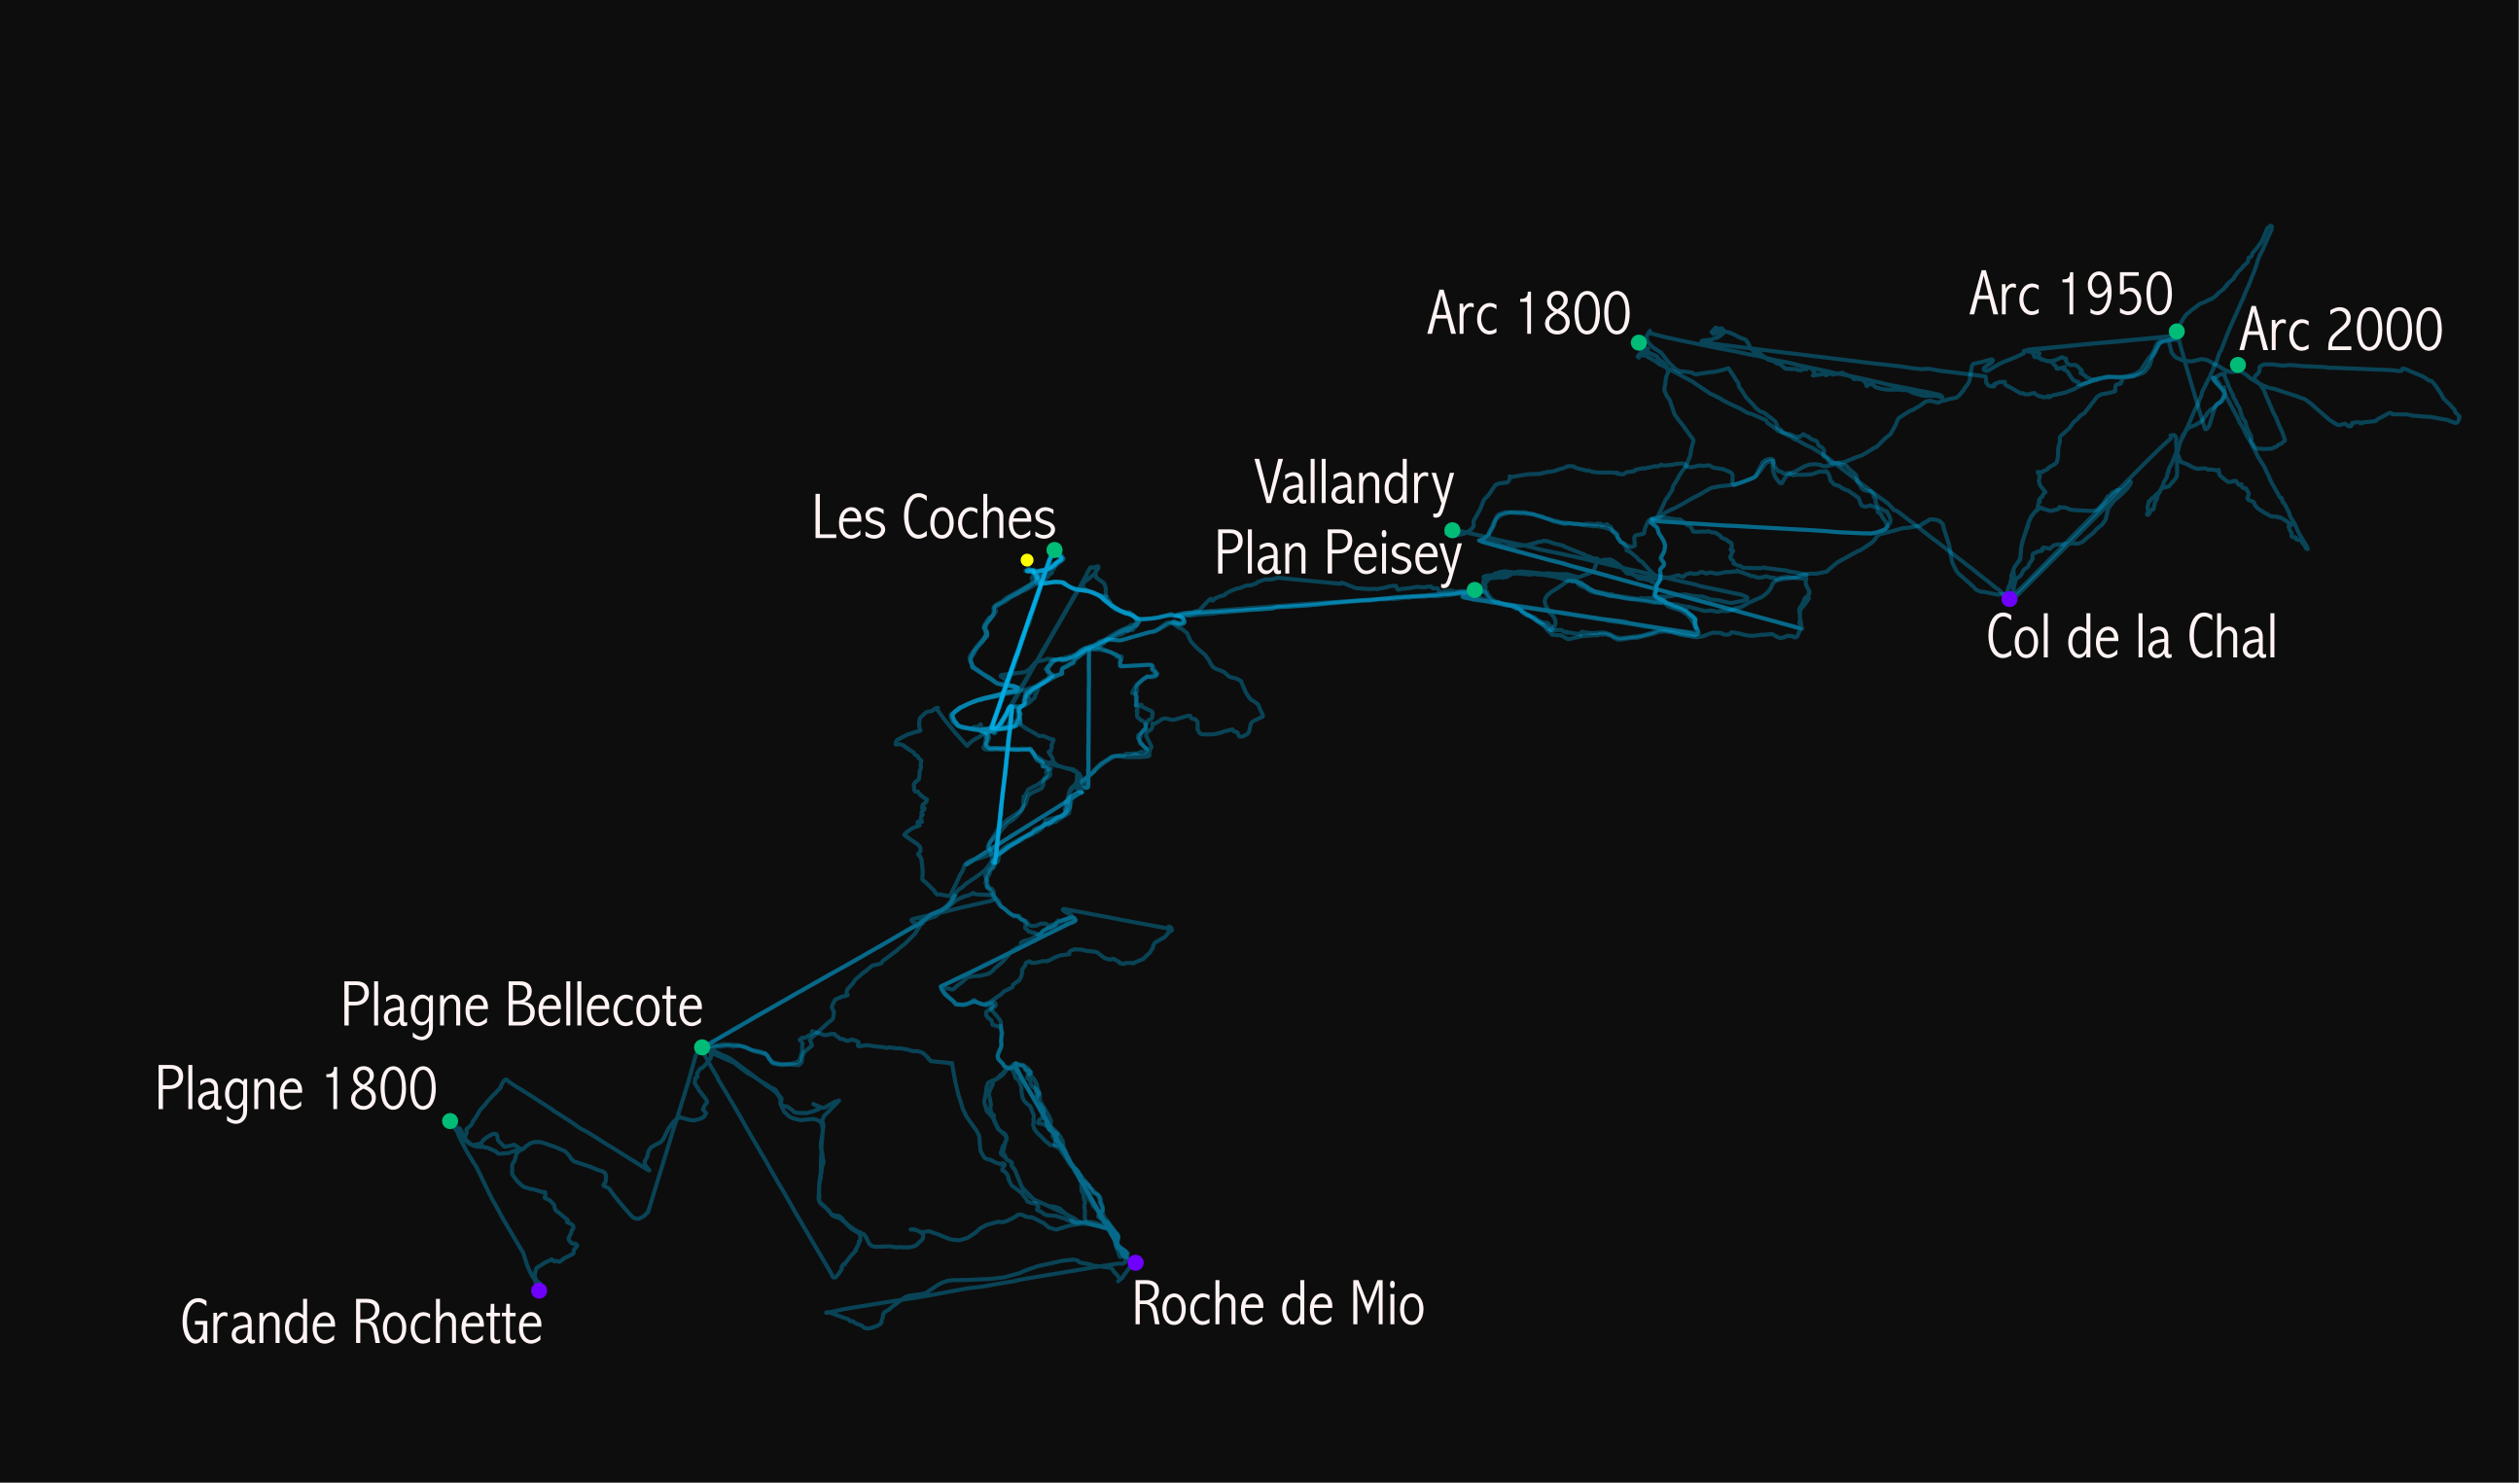
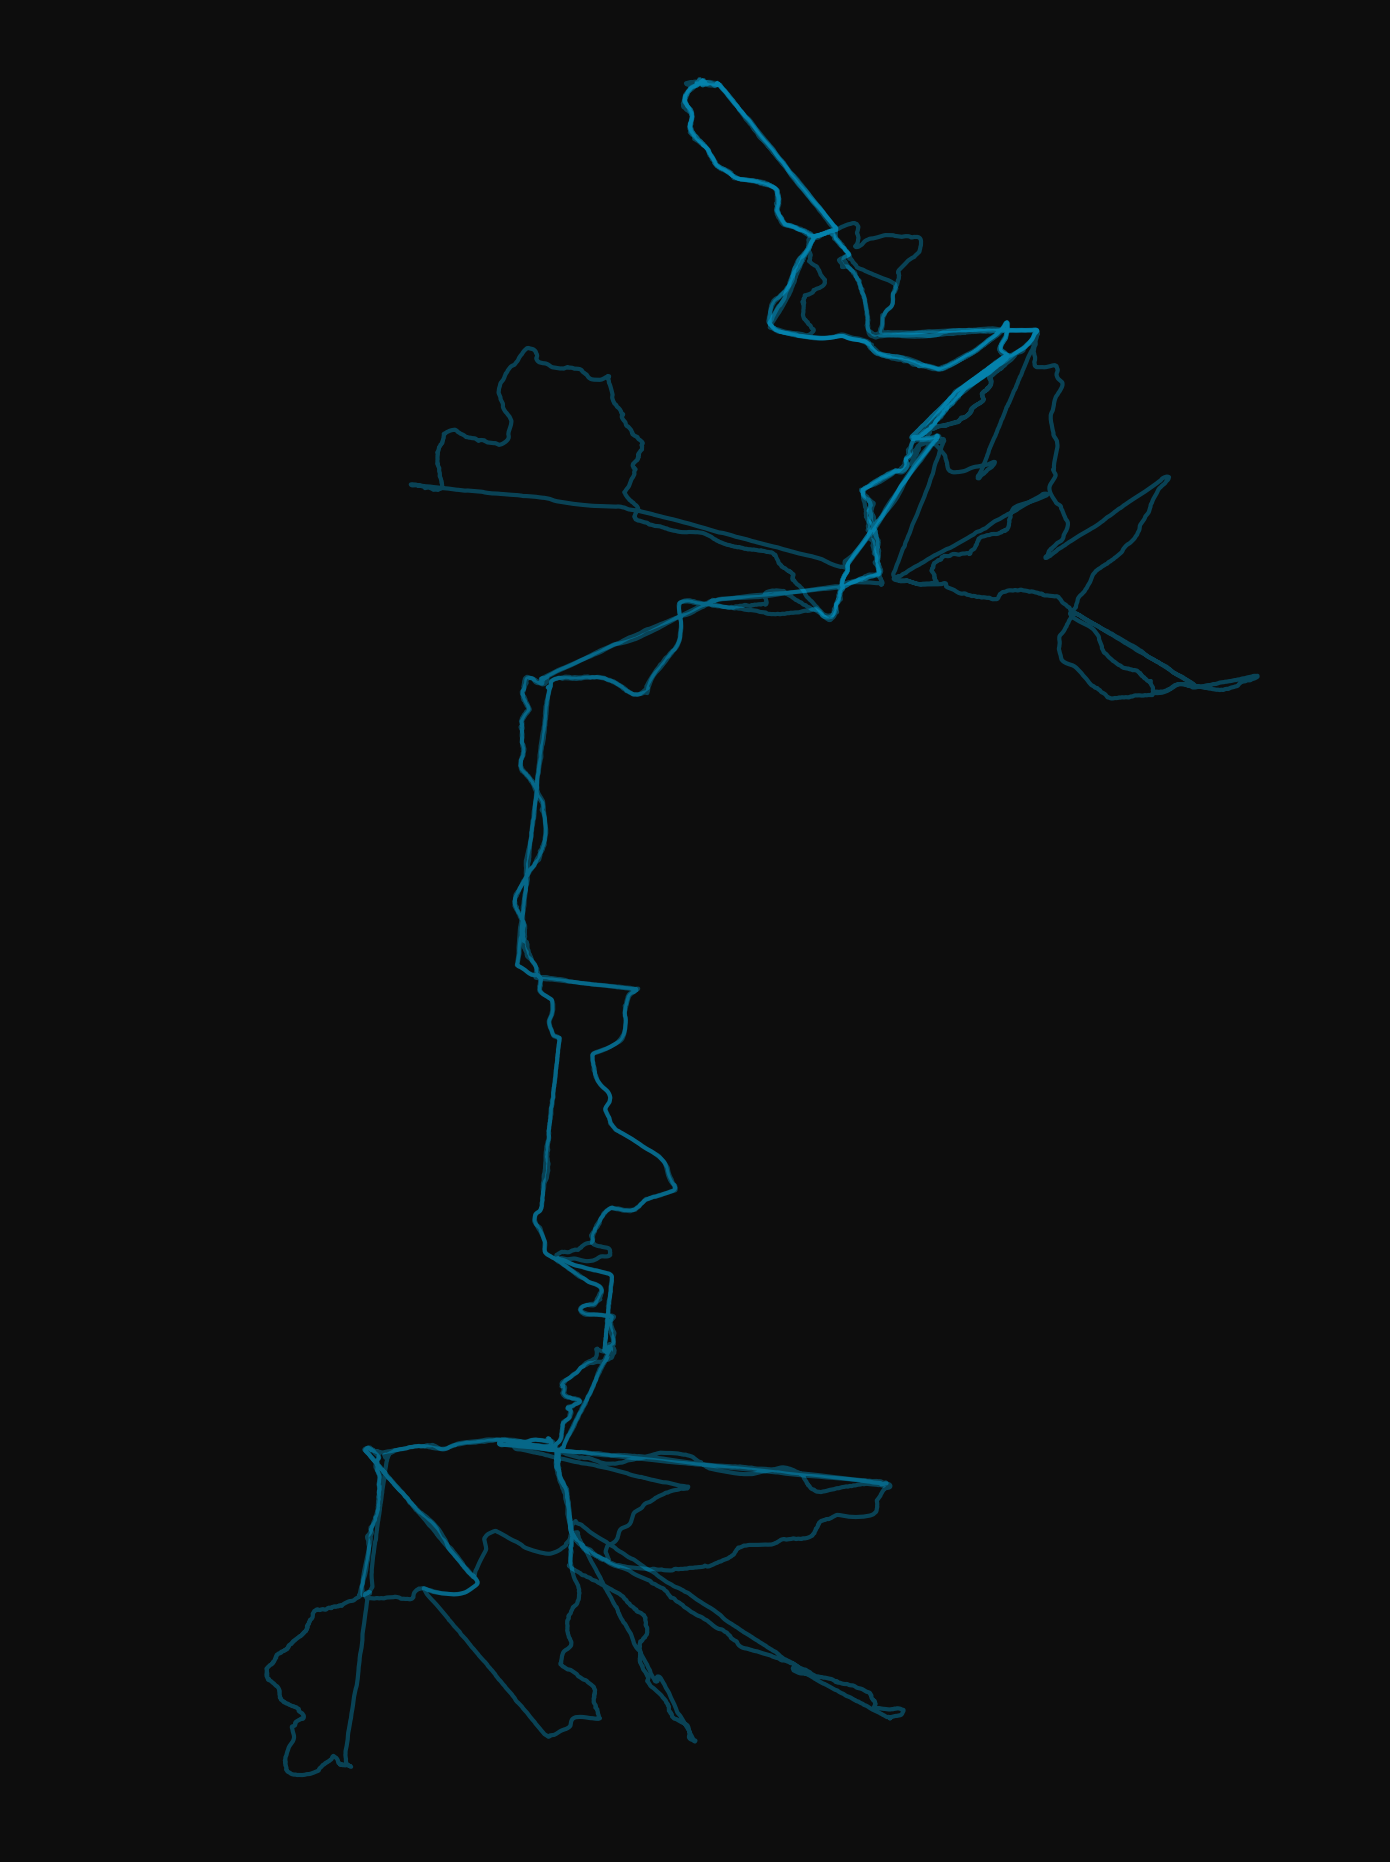
Ski heatmaps
Top: a week in La Plagne - Les Arcs (Paradiski). Bottom: Three days in the Three Valleys. This uses the gpxpy library to read gpx files in a given folder:
from os import listdir
from os.path import isfile, join
import matplotlib.pyplot as plt
import gpxpy

data_path = '/input/path/'
data = [f for f in listdir(data_path) if isfile(join(data_path,f))]

lat = []; lon = []

fig = plt.figure(facecolor = '0.05')
ax = plt.Axes(fig, [0., 0., 1., 1.], )
ax.set_aspect('equal')
ax.set_axis_off()
fig.add_axes(ax)

for activity in data:
    gpx_filename = join(data_path,activity)
    gpx_file = open(gpx_filename, 'r')
    gpx = gpxpy.parse(gpx_file)

    for track in gpx.tracks:
        for segment in track.segments:
            for point in segment.points:
                lat.append(point.latitude)
                lon.append(point.longitude)
    plt.plot(lon, lat, color = 'deepskyblue', lw = 1, alpha = 0.3)
    lat = []; lon = []

filename = 'output.png'
plt.savefig(filename, facecolor = fig.get_facecolor(),
			bbox_inches='tight', pad_inches=0, dpi=300)